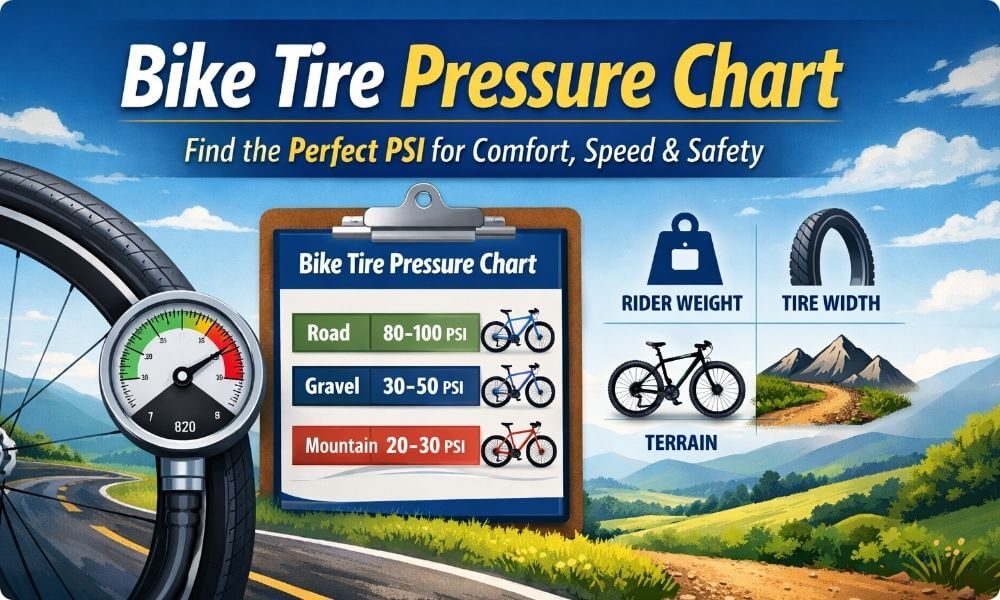
Bike Tire Pressure Chart: Find the Perfect PSI
Last updated on March 20th, 2026
Getting your tire pressure right can make a bigger difference than most riders expect. It affects how fast your bike feels, how much grip you have in corners, how comfortable the ride is, and how likely you are to get flats. The good news is that you do not need to guess.
This guide gives you a practical bike tire pressure chart you can use as a starting point. From there, you can make small changes based on your weight, your tire size, and the kind of surface you ride on. That matters because the “best” pressure is rarely one fixed number for everyone. A road rider on smooth pavement will need something very different from a gravel rider on loose surfaces or a commuter carrying a backpack over rough city streets.
Use the chart below to find a solid starting range, then fine-tune from there.
Bike Tire Pressure Chart
The chart below is designed to help you get close quickly. These numbers are starting points for average riding conditions and assume a normal bike setup in good condition. Rear tires often need a little more pressure than front tires because they carry more weight.
Road Bike Tire Pressure Chart
| Tire Width | Rider Weight | Front PSI | Rear PSI |
| 23 mm | 132 lb | 80 | 85 |
| 23 mm | 132–165 lb | 85 | 90 |
| 23 mm | 165–198 lb | 90 | 95 |
| 23 mm | 198 lb | 95 | 100 |
| 25 mm | 132 lb | 72 | 76 |
| 25 mm | 132–165 lb | 76 | 80 |
| 25 mm | 165–198 lb | 80 | 84 |
| 25 mm | 198 lb | 84 | 90 |
| 28 mm | 132 lb | 60 | 64 |
| 28 mm | 132–165 lb | 64 | 68 |
| 28 mm | 165–198 lb | 68 | 72 |
| 28 mm | 198 lb | 72 | 78 |
| 30–32 mm | 132 lb | 50 | 54 |
| 30–32 mm | 132–165 lb | 54 | 58 |
| 30–32 mm | 165–198 lb | 58 | 62 |
| 30–32 mm | 198 lb | 62 | 68 |
Gravel Bike Tire Pressure Chart
| Tire Width | Rider Weight | Front PSI | Rear PSI |
| 35–38 mm | 132 lb | 38 | 42 |
| 35–38 mm | 132–165 lb | 42 | 46 |
| 35–38 mm | 165–198 lb | 46 | 50 |
| 35–38 mm | 198 lb | 50 | 54 |
| 40–45 mm | 132 lb | 30 | 34 |
| 40–45 mm | 132–165 lb | 34 | 38 |
| 40–45 mm | 165–198 lb | 38 | 42 |
| 40–45 mm | 198 lb | 42 | 46 |
| 47–50 mm | 132 lb | 24 | 28 |
| 47–50 mm | 132–165 lb | 28 | 32 |
| 47–50 mm | 165–198 lb | 32 | 36 |
| 47–50 mm | 198 lb | 36 | 40 |
Mountain Bike Tire Pressure Chart
| Tire Width | Rider Weight | Front PSI | Rear PSI |
| 2.1–2.25″ | 132 lb | 20 | 22 |
| 2.1–2.25″ | 132–165 lb | 22 | 24 |
| 2.1–2.25″ | 165–198 lb | 24 | 26 |
| 2.1–2.25″ | 198 lb | 26 | 28 |
| 2.3–2.4″ | 132 lb | 18 | 20 |
| 2.3–2.4″ | 132–165 lb | 20 | 22 |
| 2.3–2.4″ | 165–198 lb | 22 | 24 |
| 2.3–2.4″ | 198 lb | 24 | 26 |
| 2.5–2.6″ | 132 lb | 16 | 18 |
| 2.5–2.6″ | 132–165 lb | 18 | 20 |
| 2.5–2.6″ | 165–198 lb | 20 | 22 |
| 2.5–2.6″ | 198 lb | 22 | 24 |
Hybrid / Commuter Bike Tire Pressure Chart
| Tire Width | Rider Weight | Front PSI | Rear PSI |
| 32–35 mm | 132 lb | 48 | 52 |
| 32–35 mm | 132–165 lb | 52 | 56 |
| 32–35 mm | 165–198 lb | 56 | 60 |
| 32–35 mm | 198 lb | 60 | 65 |
| 38–40 mm | 132 lb | 42 | 46 |
| 38–40 mm | 132–165 lb | 46 | 50 |
| 38–40 mm | 165–198 lb | 50 | 54 |
| 38–40 mm | 198 lb | 54 | 58 |
| 42–45 mm | 132 lb | 36 | 40 |
| 42–45 mm | 132–165 lb | 40 | 44 |
| 42–45 mm | 165–198 lb | 44 | 48 |
| 42–45 mm | 198 lb | 48 | 52 |
Use these numbers as a starting point, not a rule carved in stone. Small changes of 2 to 4 PSI can noticeably change how your bike feels.
How to Use the Bike Tire Pressure Chart
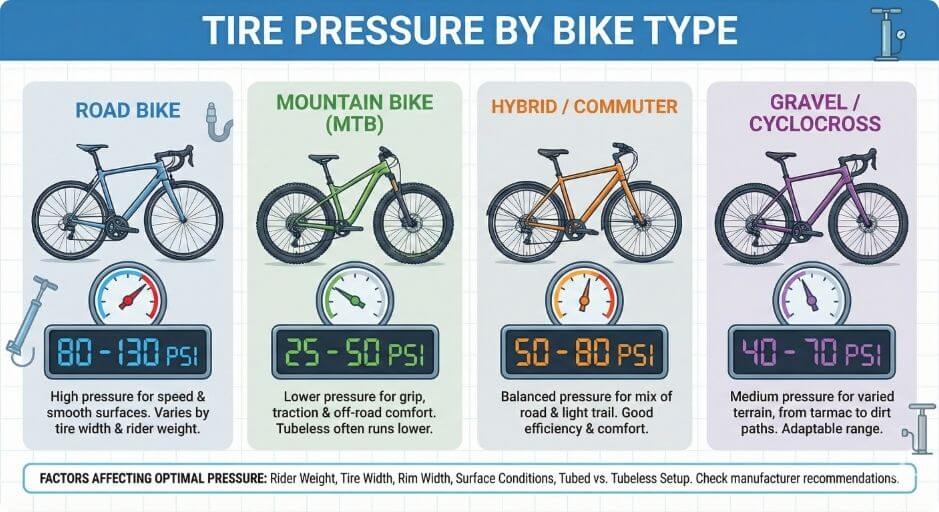
Start by choosing the section that matches your bike type. A road bike, gravel bike, mountain bike, and hybrid bike all use very different pressure ranges, so this step matters more than people think.
Next, find your tire width. This is usually printed on the tire sidewall. On road and gravel tires, it is often shown in millimeters, such as 25 mm, 28 mm, or 40 mm. On mountain bike tires, it is usually shown in inches, such as 2.25″ or 2.4″.
Then match your body weight to the nearest range in the chart. If you usually ride with a backpack, loaded bags, or extra gear, think about your total riding weight rather than body weight alone. That will give you a more realistic starting point.
Once you have your starting pressure, remember that the front and rear tire do not usually need to be the same. The rear tire supports more of your weight, so it often runs a little higher.
After that, think about where you ride most. Smooth pavement usually feels best with slightly higher pressure than rough roads, gravel, or trails. If you spend most of your time on cracked roads or rough mixed surfaces, you may be more comfortable dropping a few PSI from the chart.
The easiest way to fine-tune is to start with the recommended number, ride, and adjust in small steps. Do not jump by 10 PSI at a time. Even a 2 or 3 PSI change can be enough to notice.
When to Adjust Above or Below the Chart
The chart gives you a starting point. Real-world riding tells you whether you should go a bit higher or lower.
Go a little lower when the ride feels harsh, your hands or body get tired too quickly, or the bike feels skittish on rough surfaces. Lower pressure can improve comfort and help the tire grip better, especially on gravel, dirt, or broken pavement.
Go a little higher when the tire feels too soft, the bike feels vague in turns, or you hit the rim on sharp bumps. A higher setting can also help if you carry luggage or ride mostly on smooth pavement where efficiency matters more.
The trick is to make small changes and pay attention. Drop 2 PSI, ride again, and notice what changed. Add 2 PSI the next day if needed. This is much better than making big jumps and getting lost.
One easy method is this: start with the chart, ride your normal route, and ask yourself three questions. Does the bike feel comfortable? Does it feel stable in turns? Does it feel smooth rather than bouncy? If the answer is no to any of those, adjust slowly.
FAQ: Bike Tire Pressure Chart
1. What is the ideal bike tire pressure for my bike?
The ideal bike tire pressure depends on your bike type, tire width, and rider weight. Use a bike tire pressure chart as a starting point. Road bikes usually require higher PSI for speed and efficiency, gravel bikes need slightly lower PSI for grip on rough surfaces, mountain bikes run even lower for traction, and hybrid or commuter bikes fall in between. Always adjust a few PSI up or down based on how the bike feels.
2. How do I read a bike tire pressure chart?
To read a bike tire pressure chart, first find your bike type (road, gravel, mountain, or hybrid). Then match your tire width and weight range to the suggested front and rear PSI. The chart provides a starting point—fine-tune your tires slightly based on terrain and comfort. The rear tire usually runs a little higher PSI than the front because it carries more load.
3. Should front and rear tires have the same pressure?
Not always. The rear tire typically carries more weight, so it usually needs slightly higher PSI than the front. Using a bike tire pressure chart can help you find the right range for both tires. Adjust small amounts up or down based on ride feel, terrain, and load to maintain stability and comfort.
4. How often should I check my bike tire pressure?
It’s best to check your tire pressure before most rides, especially if you ride frequently. Tires slowly lose air over time, and changes in temperature can affect PSI. Using a reliable floor pump or pressure gauge ensures your tires are in the recommended range according to your bike tire pressure chart.
5. Can rider weight affect bike tire pressure?
Yes. Rider weight is one of the main factors in determining the right tire pressure. Heavier riders often need higher PSI to prevent tire squirm or rim strikes, while lighter riders can run lower PSI for comfort and traction. Most bike tire pressure charts include weight ranges to make this adjustment easier.
Final Takeaway
The right bike tire pressure is not just about filling your tires until they feel firm. It is about matching your pressure to your bike, your tires, your weight, and the surfaces you actually ride.
A good bike tire pressure chart saves time by giving you a smart starting point. From there, the best thing you can do is test small changes. A few PSI up or down can improve comfort, grip, speed, and confidence more than many riders realize.
So start with the chart, pay attention to how the bike feels, and fine-tune from there. That simple habit will help you ride better, feel better, and avoid a lot of common mistakes.